Reports and Analytics
CINNOX Dashboard Analytics
CINNOX analytics is a powerful tool designed specifically to help your businesses better understand their customers and the support they require. With this platform, companies can access a wide range of data visualisation that enables them to quickly and easily interpret metrics related to visitors and staff engagements.
One of the key benefits of CINNOX analytics is that it allows you to gain insights into visitor enquiry patterns and trends. This is achieved by collecting data on all customer interactions, including call and chat enquiries, and presenting it in an easy-to-understand format.
Additionally, CINNOX analytics enables staff to monitor their performance more efficiently. This is achieved by providing real-time metrics related to engagement levels, response times, and other key performance indicators (KPIs). Using these insights to track and improve their performance, staff can provide a better experience for customers and drive business growth.
CINNOX Dashboard comes with Enquiry Overview and Enquiry Performance, Popular Channels and Destinations.

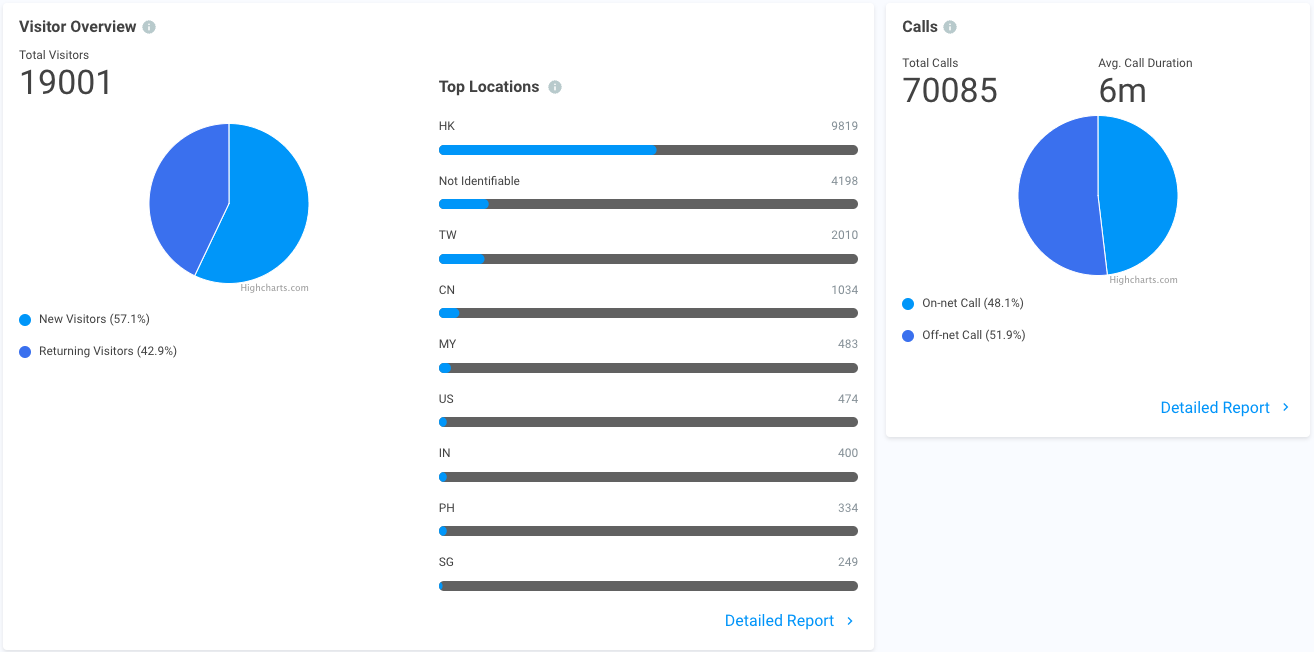
CINNOX Dashboard also provides Visitor Overview - total visitors, top location, and Call - total calls and average call duration.
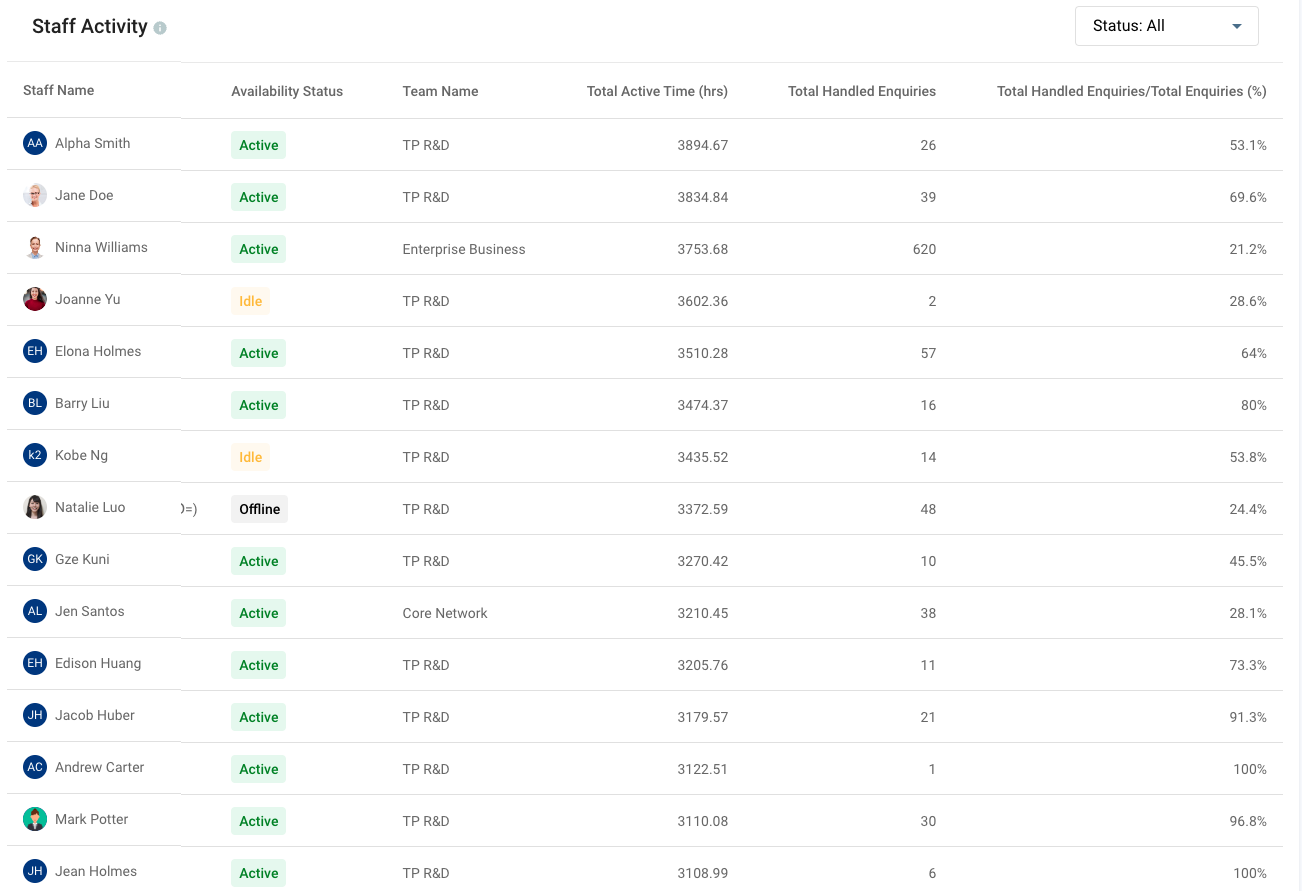
CINNOX Dashboard displays the Staff Activity - Availability Status, Team Name, Total Active Time and Handled Enquiries.
Top 20 Conversation Topics
Lastly, the CINNOX Dashboard displays the table ranking the Top 20 Conversation Topics by their counts.
- After administrators click Set as a Label, the created label is displayed as "Already a label". After set as a label, the label can be found on the Labels page and will be listed in the dropdown list when adding or searching for labels.
- You can click the Download at the top right-hand corner of the table to download the file recording all conversation topics from enquiries.

Note
- The created labels, created by administrators, supervisors, or custom roles with permission to manage labels in the CINNOX Dashboard, is applicable to both enquiries and external contacts. Details can be found in the table on the Labels page.
- Please refer to the Labelling an Enquiry page for details on labelling an Enquiry.
- Please refer to the Labelling an External Contact page for details on labelling an External Contact.
- Please refer to the Managing Labels for details on label details displayed in the Labels page's table.
- Only administrators can access the table ranking the Top 20 Conversation Topics.
- To view this table, administrators must enable the AI Suggested Label and Topic feature. Please refer to the Enable AI Suggested Label and Topic section for details.
- Conversation topics are gathered and analyzed from missed enquiries and those currently being handled by agents.
- Starting from version 4.2.0, this table displays the Top 20 Conversation Topics, and the downloadable file records all conversation topics.
As a Staff member, you can:
- View visitor activity, such as the total number of attempts to establish contact with the CINNOX staff over a given period.
- View visitor traffic over a given period.
- Analyse visitor trends over a given period.
Note that the data may vary depending on your user role and data access level, i.e., a staff administrator can view all data. In contrast, a staff member can only see activities related to them.
CINNOX Reports
CINNOX Reports is a robust platform that provides businesses access to important visual metrics and insights about visitor calls, chat enquiries, and staff engagements with customers and colleagues. One of the key features of this platform is its data visualisation interface and detailed table, which make it easy for businesses to get a clear and concise view of their performance metrics.
By collecting data on all customer interactions, including calls and chat enquiries, CINNOX Reports can provide businesses with a comprehensive view of customer behaviour. The platform uses advanced data visualisation techniques to present this data in an easy-to-understand format, allowing companies to identify patterns and trends that might go unnoticed quickly. The platform collects data on engagement metrics such as response times and visitor enquiries, enabling businesses to track and improve their performance in these areas. Companies can use these insights to refine their customer service strategies to enhance the overall customer experience and drive growth.
CINNOX Metrics Data Visualisation
CINNOX integrates the following data visualisation elements to display the metrics:
Interactive Bar chart
The interactive line chart lets you view the number of successful calls and daily call duration for a selected time range. By default, the time range is 7 days.
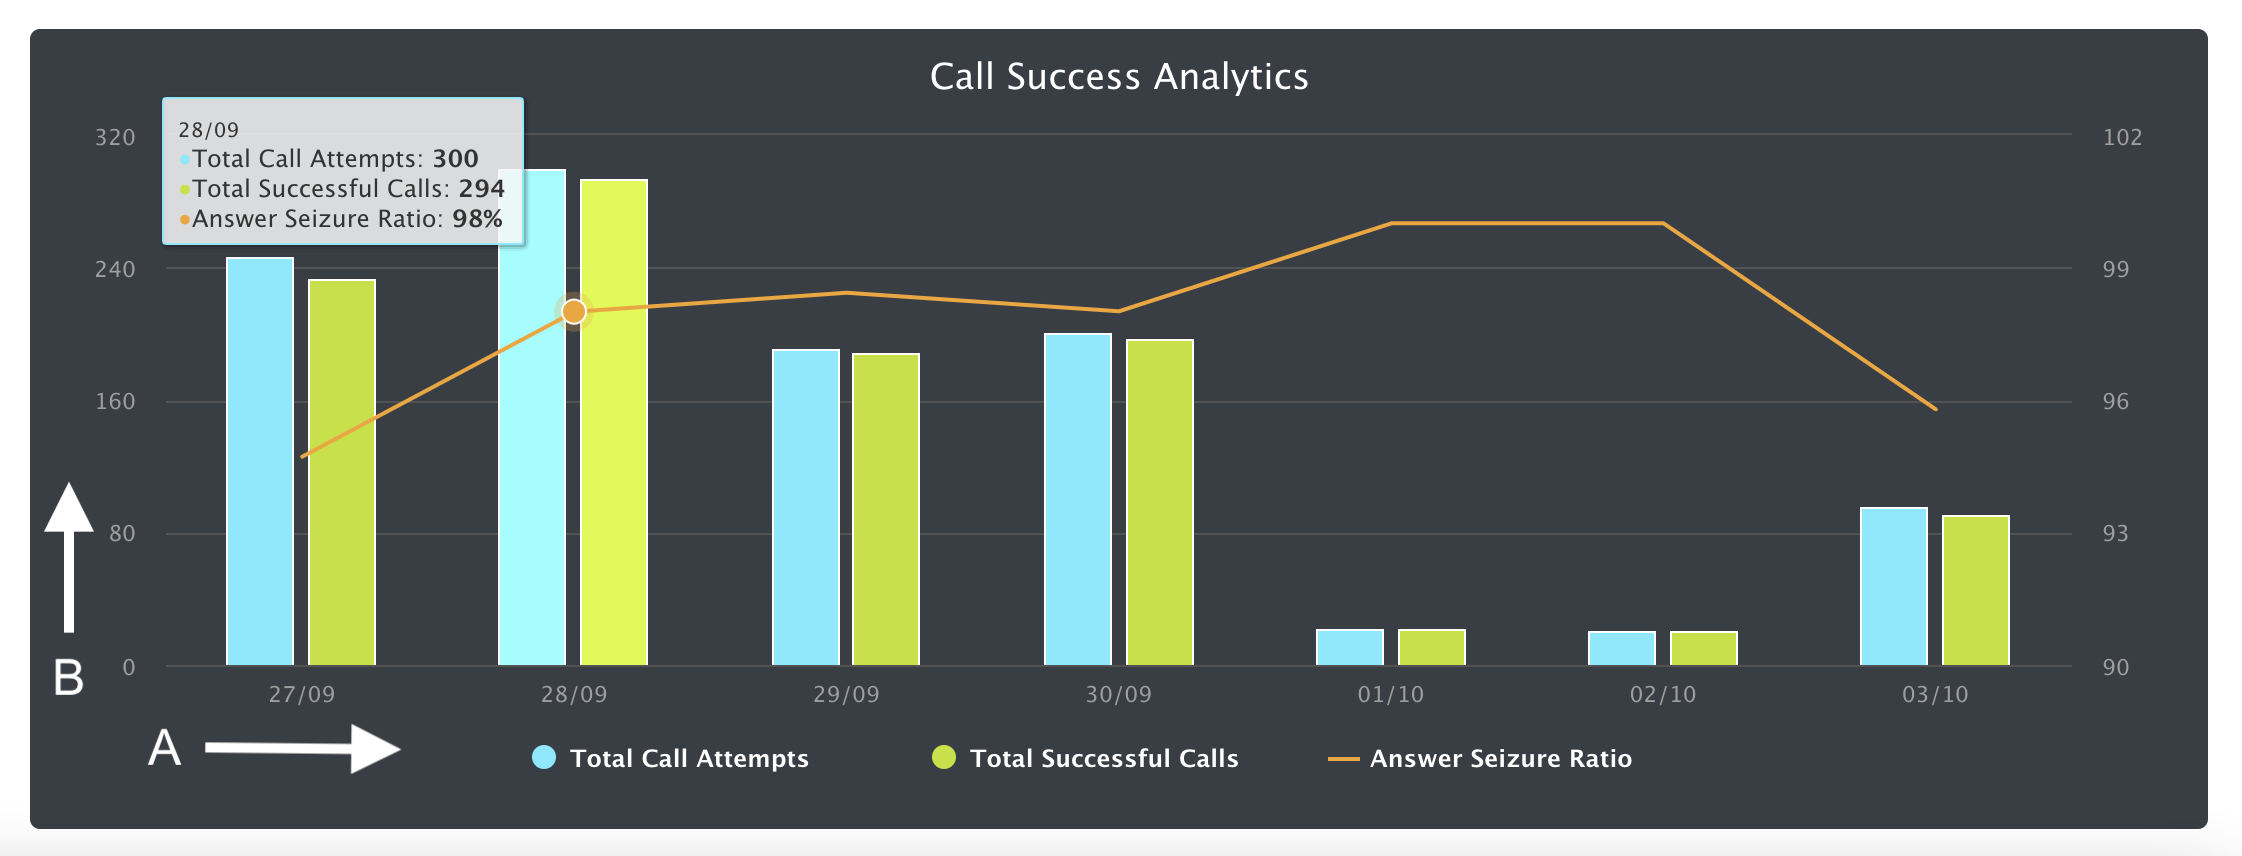
Understanding the Call Success Analytics Bar Chart Layout
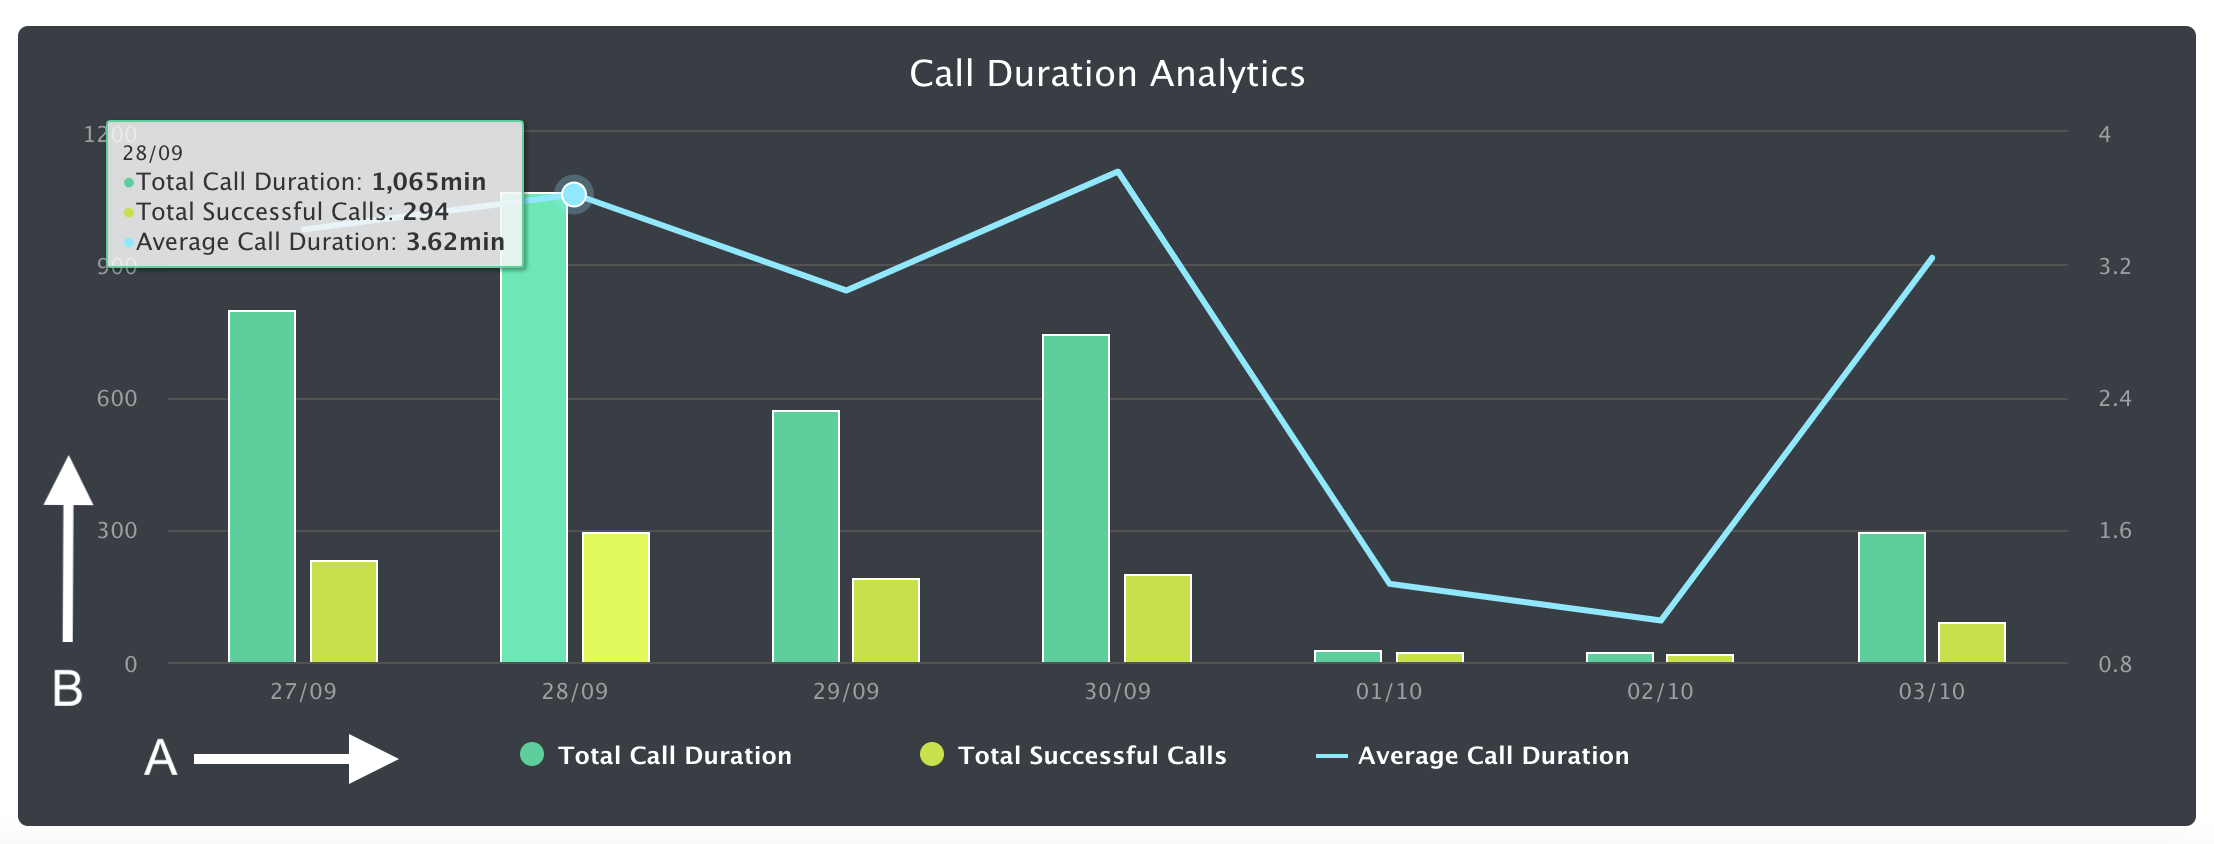
Understanding the Call Durations Analytics Bar Chart Layout
- The calendar dates appear on the horizontal X-axis of the graph (A) in the date/month format.
- The numerics appear on the vertical Y-axis of the graph (B).
Filter Report and Analytics
You can use the Filter function to refine the displayed data according to your needs.
- Navigate to Dashboard and click the filter icon at the top right-hand corner of the page.
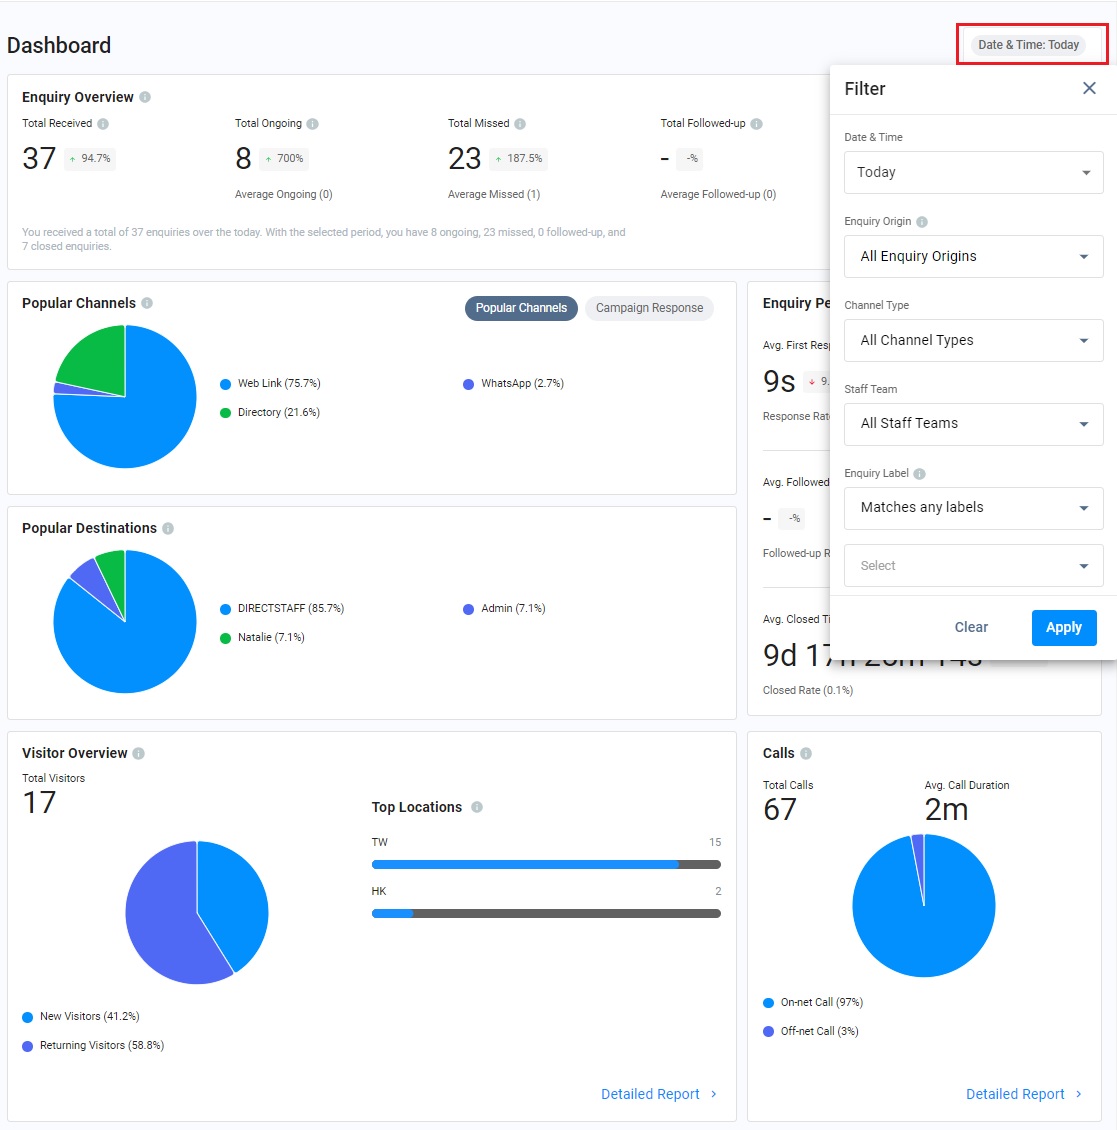
- You can sort the data using the following filters:
Filter | Description |
|---|---|
Date & Time | Select one of the date & time ranges for the data you are required to view, including:
|
Enquiry Origin | Select one of the enquiry's origins of data you are required to view, including:
|
Bulk Closed | Select enquiries that have been closed in bulk or not.
|
Channel Type | Select one of the channel types of data you are required to view, including:
|
Channel Name / Number | Select the Channel Name or Number created according to the channel type selected. |
Staff Team | Select a specific staff team that handles enquiries. All Staff Teams is the default. |
Enquiry Label | Select criteria for enquiries with labels, with options including:
|
Updated 5 months ago