Search...
Menu
Web Dashboard – Self-Debugging Guide (Chrome Browser)
If your CINNOX Web Dashboard is not functioning properly, please follow the steps below to perform a quick self-check before contacting support.
Step 1: Refresh the Page
Start with a simple refresh to resolve temporary loading issues.
- Click the Refresh button in Chrome
- Or press:
- Windows:
Ctrl + R/Ctrl + F5(hard refresh) - Mac:
⌘ + R/Shift + ⌘ + R(hard refresh)
- Windows:
Step 2: Log Out and Log Back In
If the issue persists:
- Log out of your CINNOX account
- Close the browser tab
- Reopen the CINNOX Dashboard and log in again
Step 3: Restart Google Chrome
Still not working?
- Close all Chrome windows
- Reopen Chrome
- Access the CINNOX Dashboard again
Step 4: Reproduce Issue & Capture HAR File
If the issue continues, collect technical logs for further investigation.
How to Capture a HAR File (Chrome)
-
Open Chrome DevTools:
- Windows:
F12orCtrl + Shift + I - Mac:
⌘ + Option + I
- Windows:
-
Go to the Network tab
-
Check “Preserve log”
-
Ensure recording is active (●)
-
Reproduce the issue
-
Click the Download icon in the Network panel
-
Save the file (e.g.,
yourservicename.cinnox.com.har)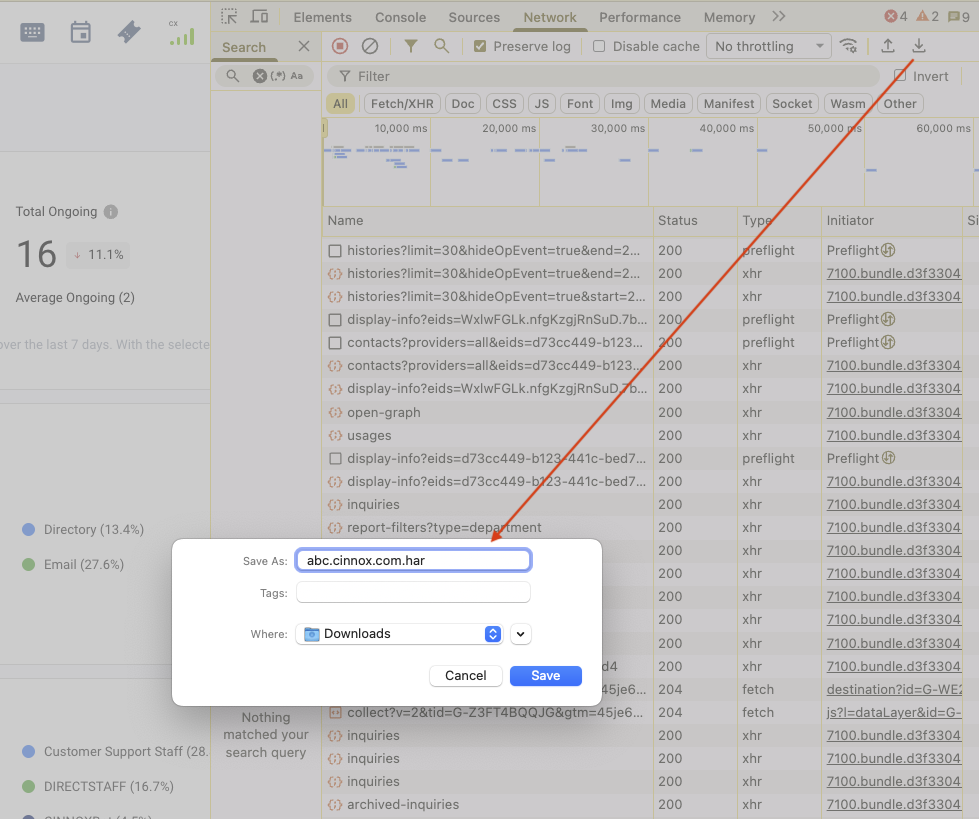
Step 5: Report to CINNOX Support
Please submit the following:
- HAR file
- Screenshots or screen recording
- Clear description of the issue
- Time of occurrence
Contact CINNOX Support:
- Email: support@cinnox.com
- Live Chat: Available in your CINNOX Web Dashboard
Previous
Troubleshooting Guide
Next
Web Browsers Notification Permissions
Last modified: 2026-05-07
Outline